OperationsMicro Business and Individual Unit
Operational Performances
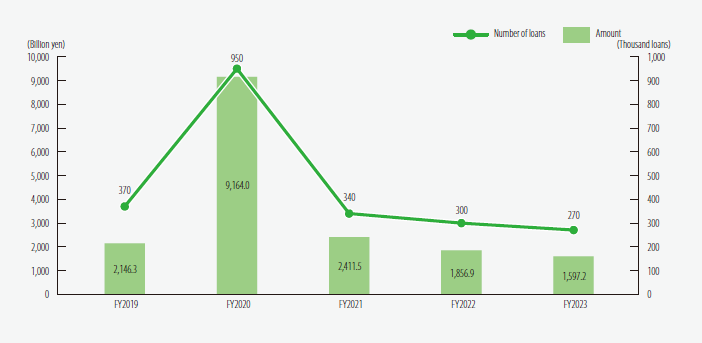
Changes in Annual Loan Operations
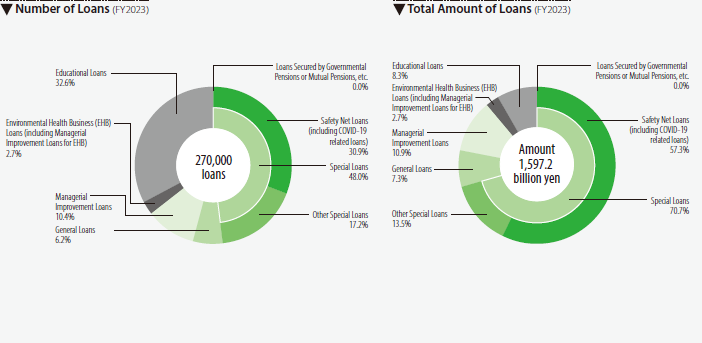
Breakdown of Loans by Scheme
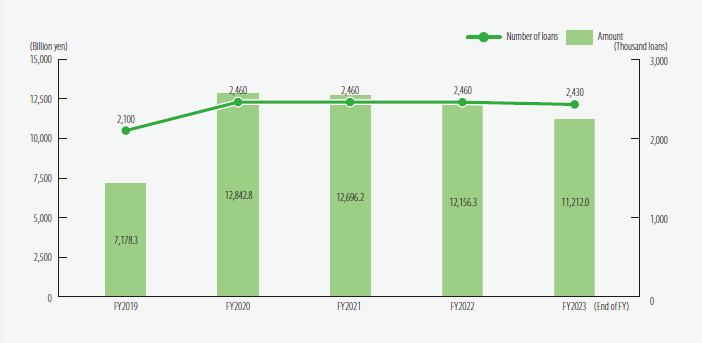
Changes in Outstanding Loans
Breakdown of Business Loans Outstanding by Industry
(Billion yen, %)
| End of FY2019 |
End of FY2020 |
End of FY2021 |
End of FY2022 |
End of FY2023 |
|
|---|---|---|---|---|---|
| Manufacturing | 574.2 (9.3) |
1,043.0 (8.8) |
1,023.4 (8.7) |
977.9 (8.7) |
888.7 (8.7) |
| Wholesale & Retail | 1,293.6 (20.9) |
2,362.7 (19.9) |
2,320.3 (19.8) |
2,220.0 (19.8) |
2,033.7 (19.8) |
| Restaurants & Hotels | 580.7 (9.4) |
1,475.1 (12.4) |
1,448.3 (12.3) |
1,372.4 (12.3) |
1,254.4 (12.2) |
| Services | 1,525.4 (24.6) |
3,106.8 (26.2) |
3,098.3 (26.4) |
2,971.4 (26.5) |
2,743.8 (26.7) |
| Construction | 911.1 (14.7) |
1,870.1 (15.7) |
1,880.1 (16.0) |
1,811.1 (16.2) |
1,667.7 (16.2) |
| Others | 1,313.6 (21.2) |
2,016.7 (17.0) |
1,964.2 (16.7) |
1,847.9 (16.5) |
1,684.6 (16.4) |
| Total | 6,198.8 (100.0) |
11,874.6 (100.0) |
11,734.8 (100.0) |
11,201.0 (100.0) |
10,273.3 (100.0) |
- Notes:
-
- Loans comprise General Loans and Environmental Health Business Loans.
- Industries are in accordance with the Japan Standard Industrial Classification as revised in March 2002.
- Figures in parentheses denote percentage of shares.
Breakdown of Environmental Health Business Loans Outstanding by Industry
(Billion yen, %)
| End of FY2019 |
End of FY2020 |
End of FY2021 |
End of FY2022 |
End of FY2023 |
|
|---|---|---|---|---|---|
| Restaurant-related services | 178.0 (51.9) |
233.0 (54.4) |
222.7 (54.3) |
211.7 (54.4) |
200.2 (54.6) |
| Beauty parlors | 73.1 (21.3) |
89.9 (21.0) |
88.8 (21.6) |
85.4 (21.9) |
81.0 (22.1) |
| Hotels | 53.9 (15.7) |
63.2 (14.8) |
59.6 (14.5) |
55.1 (14.2) |
51.0 (13.9) |
| Barbershops | 19.4 (5.7) |
21.6 (5.0) |
20.4 (5.0) |
19.0 (4.9) |
17.6 (4.8) |
| Public baths | 8.0 (2.4) |
7.6 (1.8) |
6.9 (1.7) |
6.4 (1.6) |
6.0 (1.6) |
| Laundries | 6.7 (2.0) |
8.5 (2.0) |
8.0 (1.9) |
7.6 (2.0) |
6.9 (1.9) |
| Meat shops | 2.4 (0.7) |
2.9 (0.7) |
2.8 (0.7) |
2.6 (0.7) |
2.5 (0.7) |
| Entertainment facilities | 0.5 (0.2) |
0.7 (0.2) |
0.6 (0.1) |
0.6 (0.2) |
0.6 (0.2) |
| Others | 0.3 (0.1) |
0.3 (0.1) |
0.3 (0.1) |
0.2 (0.1) |
0.2 (0.1) |
| Total | 342.8 (100.0) |
428.0 (100.0) |
410.4 (100.0) |
389.1 (100.0) |
366.5 (100.0) |
- Note:
- Figures in parentheses denote percentage of shares.
Breakdown of Outstanding Loans by Use
(Billion yen, %)
| End of FY2019 |
End of FY2020 |
End of FY2021 |
End of FY2022 |
End of FY2023 |
|
|---|---|---|---|---|---|
| Operating funds | 3,891.8 (62.8) |
10,071.6 (84.8) |
10,073.4 (85.8) |
9,632.6 (86.0) |
8,767.9 (85.3) |
| Facility funds | 2,307.0 (37.2) |
1,803.0 (15.2) |
1,661.4 (14.2) |
1,568.3 (14.0) |
1,505.3 (14.7) |
| Total | 6,198.8 (100.0) |
11,874.6 (100.0) |
11,734.8 (100.0) |
11,201.0 (100.0) |
10,273.3 (100.0) |
- Notes:
-
- Loans comprise General Loans and Environmental Health Business Loans.
- Figures in parentheses denote percentage of shares.
Number of Borrowers
(Number of borrowers)
| End of FY2019 |
End of FY2020 |
End of FY2021 |
End of FY2022 |
End of FY2023 |
|
|---|---|---|---|---|---|
| Number of borrowers | 881,026 | 1,177,346 | 1,197,384 | 1,197,327 | 1,170,623 |
- Note:
- Loans comprise General Loans and Environmental Health Business Loans.
Average Loan Balance per Business
(Thousand yen)
| End of FY2019 |
End of FY2020 |
End of FY2021 |
End of FY2022 |
End of FY2023 |
|
|---|---|---|---|---|---|
| Average loan balance per business | 7,036 | 10,085 | 9,800 | 9,355 | 8,775 |
- Note:
- Loans comprise General Loans and Environmental Health Business Loans.
Educational Loans Outstanding, etc.
(Billion yen)
| End of FY2019 |
End of FY2020 |
End of FY2021 |
End of FY2022 |
End of FY2023 |
|
|---|---|---|---|---|---|
| Educational Loans | 973.6 | 963.9 | 958.5 | 954.0 | 938.2 |
| Loans Secured by Governmental Pensions and Mutual Pensions,etc. | 5.8 | 4.2 | 2.8 | 1.2 | 0.4 |
Breakdown of Loans by Credit Amount
(Number of loans, %)
| FY2019 | FY2020 | FY2021 | FY2022 | FY2023 | |
|---|---|---|---|---|---|
| Up to 3 million yen | 87,643 (34.2) |
229,761 (26.6) |
80,952 (32.2) |
71,898 (34.7) |
68,020 (36.1) |
| Over 3 million yen and up to 5 million yen | 52,774 (20.6) |
151,201 (17.5) |
48,677 (19.3) |
41,443 (20.0) |
38,403 (20.4) |
| Over 5 million yen and up to 8 million yen | 34,586 (13.5) |
102,930 (11.9) |
34,259 (13.6) |
27,116 (13.1) |
24,659 (13.1) |
| Over 8 million yen | 80,994 (31.6) |
379,998 (44.0) |
87,856 (34.9) |
66,696 (32.2) |
57,103 (30.3) |
| Total | 255,997 (100.0) |
863,890 (100.0) |
251,744 (100.0) |
207,153 (100.0) |
188,185 (100.0) |
- Notes:
-
- Loans comprise General Loans and Environmental Health Business Loans.
- Figures in parentheses denote percentage of shares.
Breakdown of Loans by Number of Employees of Borrowers
(Number of loans, %)
| FY2019 | FY2020 | FY2021 | FY2022 | FY2023 | |
|---|---|---|---|---|---|
| 4 or fewer | 166,749 (65.1) |
564,073 (65.3) |
185,748 (73.8) |
151,568 (73.2) |
134,821 (71.6) |
| 5-9 | 51,647 (20.2) |
167,596 (19.4) |
39,944 (15.9) |
33,512 (16.2) |
31,539 (16.8) |
| 10-19 | 23,108 (9.0) |
80,433 (9.3) |
16,783 (6.7) |
14,018 (6.8) |
13,760 (7.3) |
| 20 or more | 14,489 (5.7) |
51,785 (6.0) |
9,269 (3.7) |
8,055 (3.9) |
8,065 (4.3) |
| Total | 255,993 (100.0) |
863,887 (100.0) |
251,744 (100.0) |
207,153 (100.0) |
188,185 (100.0) |
- Notes:
-
- Loans comprise General Loans and Environmental Health Business Loans.
- Figures in parentheses denote percentage of shares.
Breakdown of Loans by Type of Collateral
(Number of loans, %)
| FY2019 | FY2020 | FY2021 | FY2022 | FY2023 | ||
|---|---|---|---|---|---|---|
| No-collateral | 223,441 (87.3) |
857,271 (99.2) |
247,087 (98.2) |
203,107 (98.1) |
183,512 (97.5) |
|
| Collateral | Real estate (including partial collateral) | 32,522 (12.7) |
6,602 (0.8) |
4,640 (1.8) |
4,033 (1.9) |
4,657 (2.5) |
| Securities | 4 (0.0) |
1 (0.0) |
- (-) |
1 (0.0) |
1 (0.0) |
|
| Credit Guarantee Corporations(CGCs) | - (-) |
- (-) |
- (-) |
- (-) |
- (-) |
|
| Others | - (-) |
- (-) |
- (-) |
- (-) |
- (-) |
|
| Total | 255,967 (100.0) |
863,874 (100.0) |
251,727 (100.0) |
207,141 (100.0) |
188,170 (100.0) |
|
- Notes:
-
- Loans comprise General Loans and Environmental Health Business Loans.
- Figures in parentheses denote percentage of shares.
- Partial collateral refers to real estate or other collateral whose estimated values do not reach amounts borrowed. Partial collateral of "Securities," "Credit Guarantee Corporations" and "Others" are included in "Real estate".