Loan Programs
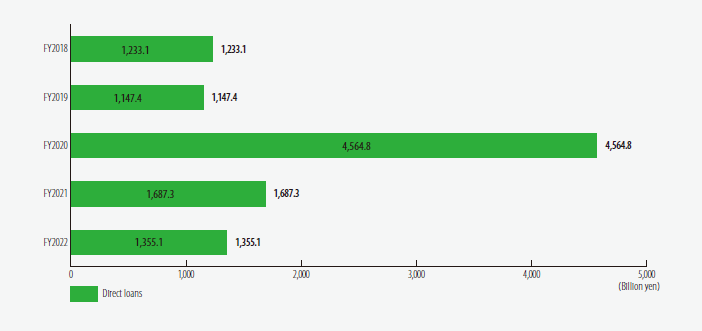
Changes in Annual Loan Operations
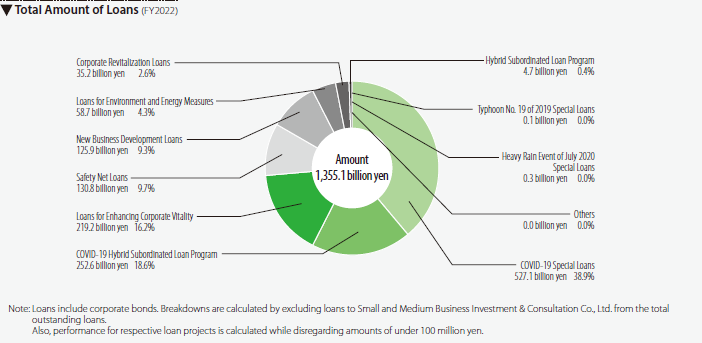
Breakdown of Loans by Scheme
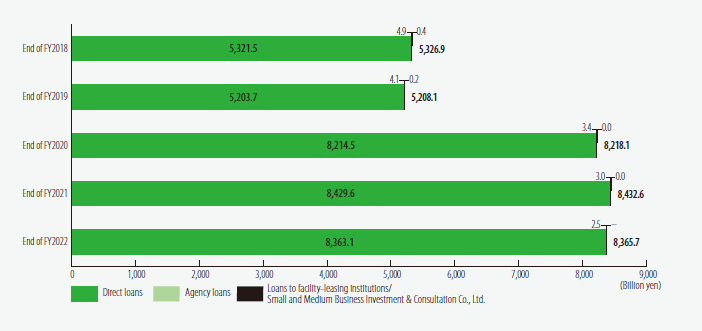
Changes in Outstanding Loans
Breakdown of Outstanding Loans by Industry
(Billion yen,%)
| End of FY2018 |
End of FY2019 |
End of FY2020 |
End of FY2021 |
End of FY2022 |
|
|---|---|---|---|---|---|
| Manufacturing | 2,487.1 (46.7) |
2,387.4 (45.8) |
3,220.1 (39.2) |
3,231.1 (38.3) |
3,222.2 (38.5) |
| Construction | 252.1 (4.7) |
249.4 (4.8) |
516.4 (6.3) |
534.4 (6.3) |
527.1 (6.3) |
| Wholesale & retail | 834.3 (15.7) |
787.1 (15.1) |
1,413.7 (17.2) |
1,450.1 (17.2) |
1,436.4 (17.2) |
| Transportation & telecommunications | 538.2 (10.1) |
549.9 (10.6) |
850.6 (10.4) |
888.7 (10.5) |
903.1 (10.8) |
| Services | 584.2 (11.0) |
612.5 (11.8) |
1,488.9 (18.1) |
1,608.2 (19.1) |
1,585.4 (19.0) |
| Others | 630.2 (11.8) |
621.1 (11.9) |
728.1 (8.9) |
719.8 (8.5) |
691.2 (8.3) |
| Total | 5,326.4 (100.0) |
5,207.9 (100.0) |
8,218.0 (100.0) |
8,432.6 (100.0) |
8,365.7 (100.0) |
- Notes:
-
- Loans include corporate bonds. Outstanding balances are calculated by deducting the amounts of loans to facility-leasing institutions/Small and Medium Business Investment & Consultation Co., Ltd. from the total balance.
- Figures in parentheses denote percentage of shares.
Breakdown of Outstanding Loans by Use
(Billion yen,%)
| End of FY2018 |
End of FY2019 |
End of FY2020 |
End of FY2021 |
End of FY2022 |
|
|---|---|---|---|---|---|
| Operating funds | 3,013.5 (56.6) |
2,785.2 (53.5) |
5,919.4 (72.0) |
6,184.6 (73.3) |
6,090.7 (72.8) |
| Facility funds | 2,312.8 (43.4) |
2,422.6 (46.5) |
2,298.5 (28.0) |
2,247.9 (26.7) |
2,274.9 (27.2) |
| Total | 5,326.4 (100.0) |
5,207.9 (100.0) |
8,218.0 (100.0) |
8,432.6 (100.0) |
8,365.7 (100.0) |
- Notes:
-
- Loans include corporate bonds. Outstanding balances are calculated by deducting the amounts of loans to facility-leasing institutions/Small and Medium Business Investment & Consultation Co., Ltd. from the total balance.
- Figures in parentheses denote percentage of shares.
Number of Borrowers
(Number of borrowers)
| End of FY2018 |
End of FY2019 |
End of FY2020 |
End of FY2021 |
End of FY2022 |
|
|---|---|---|---|---|---|
| Number of borrowers | 43,929 | 44,102 | 61,074 | 62,010 | 62,004 |
Note:
Figures cover only businesses with direct loans.
Average Loan Balance per Business
(Million yen)
| End of FY2018 |
End of FY2019 |
End of FY2020 |
End of FY2021 |
End of FY2022 |
|
|---|---|---|---|---|---|
| Average loan balance per business | 121 | 117 | 134 | 135 | 134 |
Note:
Figures cover only businesses with direct loans.
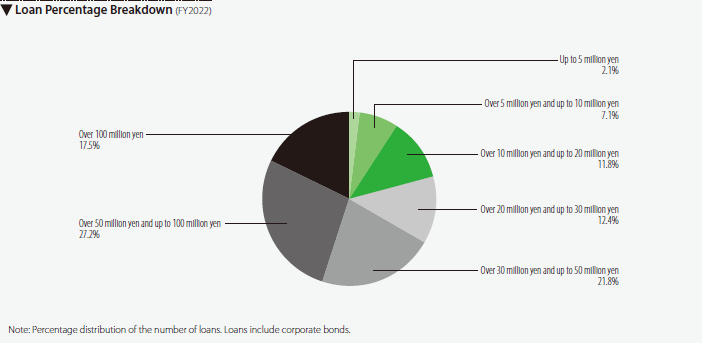
Loans by Credit Amount
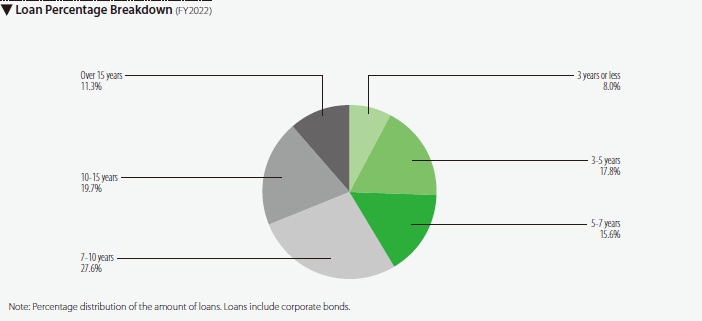
Loans by Repayment Period